Dashboards
Once you have your projects set up, save the graphs that mean the most to you in a dashboard for easy access.
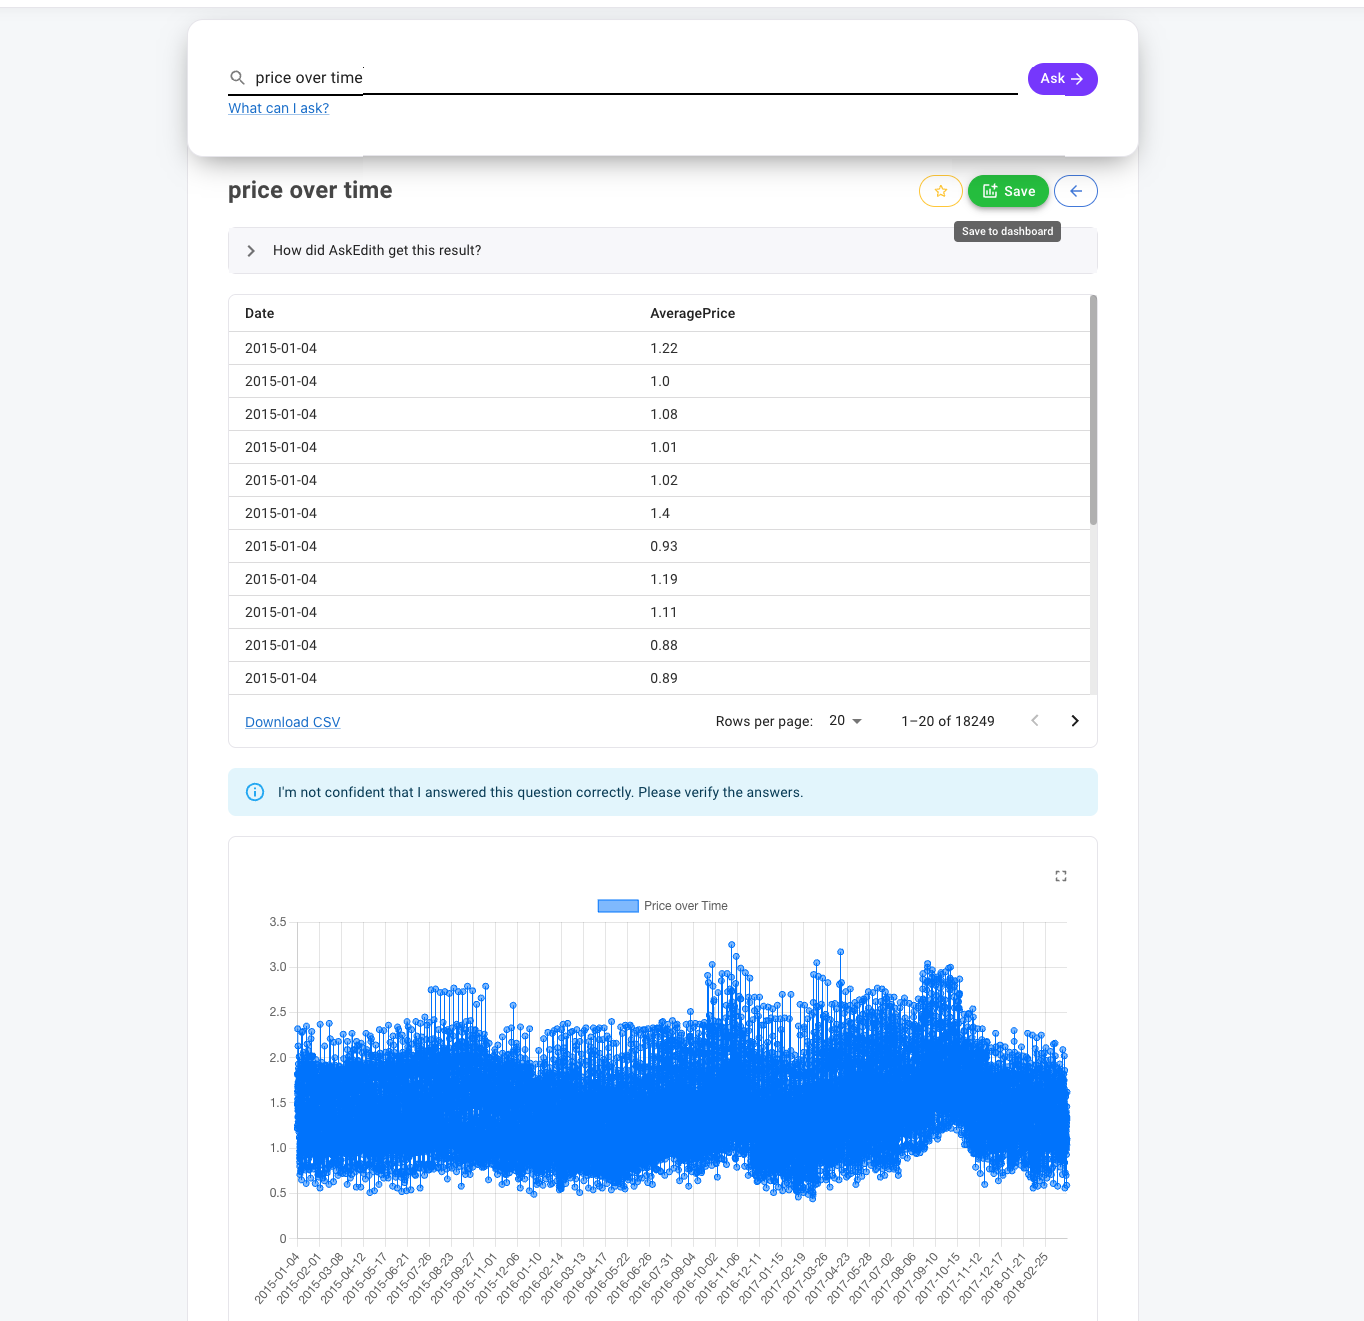
After you ask a question, click the green Save dashboard button at the top of your results page.
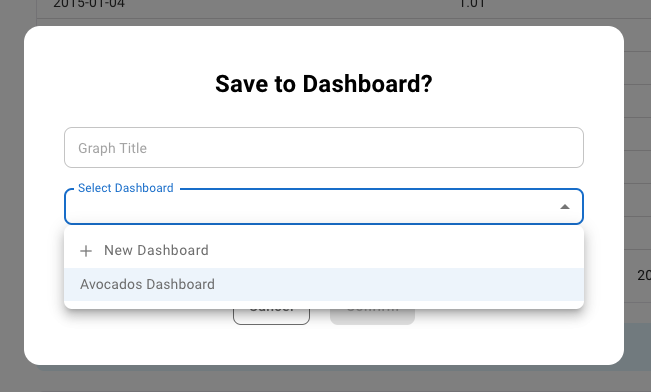
Next you will have the option to title your graph, and you can pick from adding the graph to an existing dashboard or creating a new dashboard.
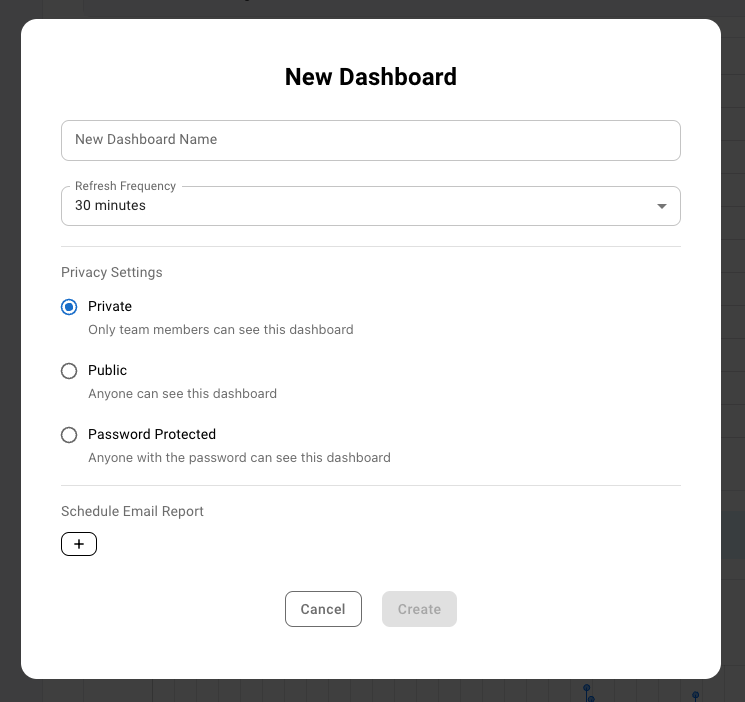
If you choose to create a new dashboard, you will get options for the dashboard name, for privacy settings, and for how often the graphs on your dashboard will refresh their data.
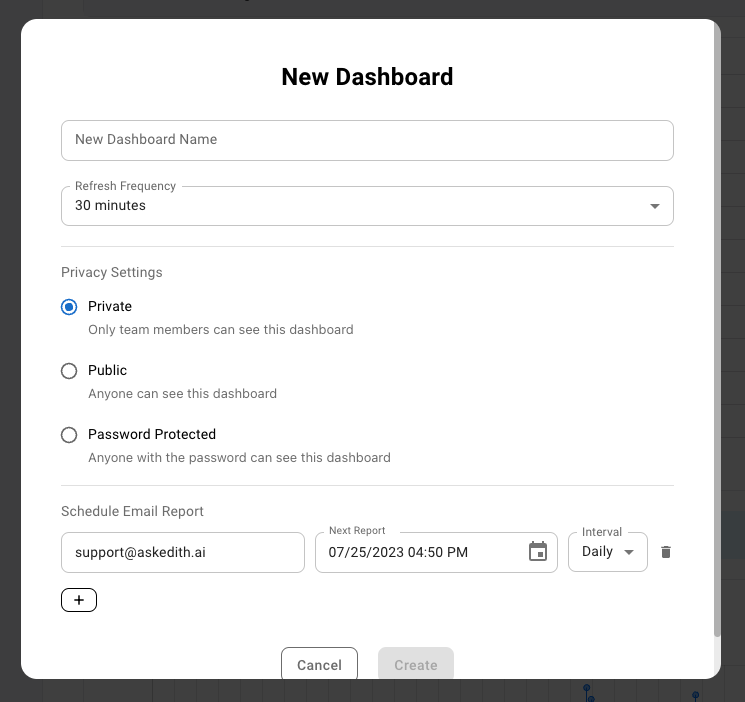
At the bottom, there is an additional option to schedule an email report. Here you can set it up so that your dashboard will be sent to an email of your choice, and how often. Just put in the email you want the dashboard to be sent to, then select when you want the first report to send, then pick the interval.
You can have a report sent once, once every day, once every week, or once a month. For this example I've set it to send the first report at 4:50 PM and the interval is Daily. So every day at 4:50 PM my email will receive an email version of this dashboard.
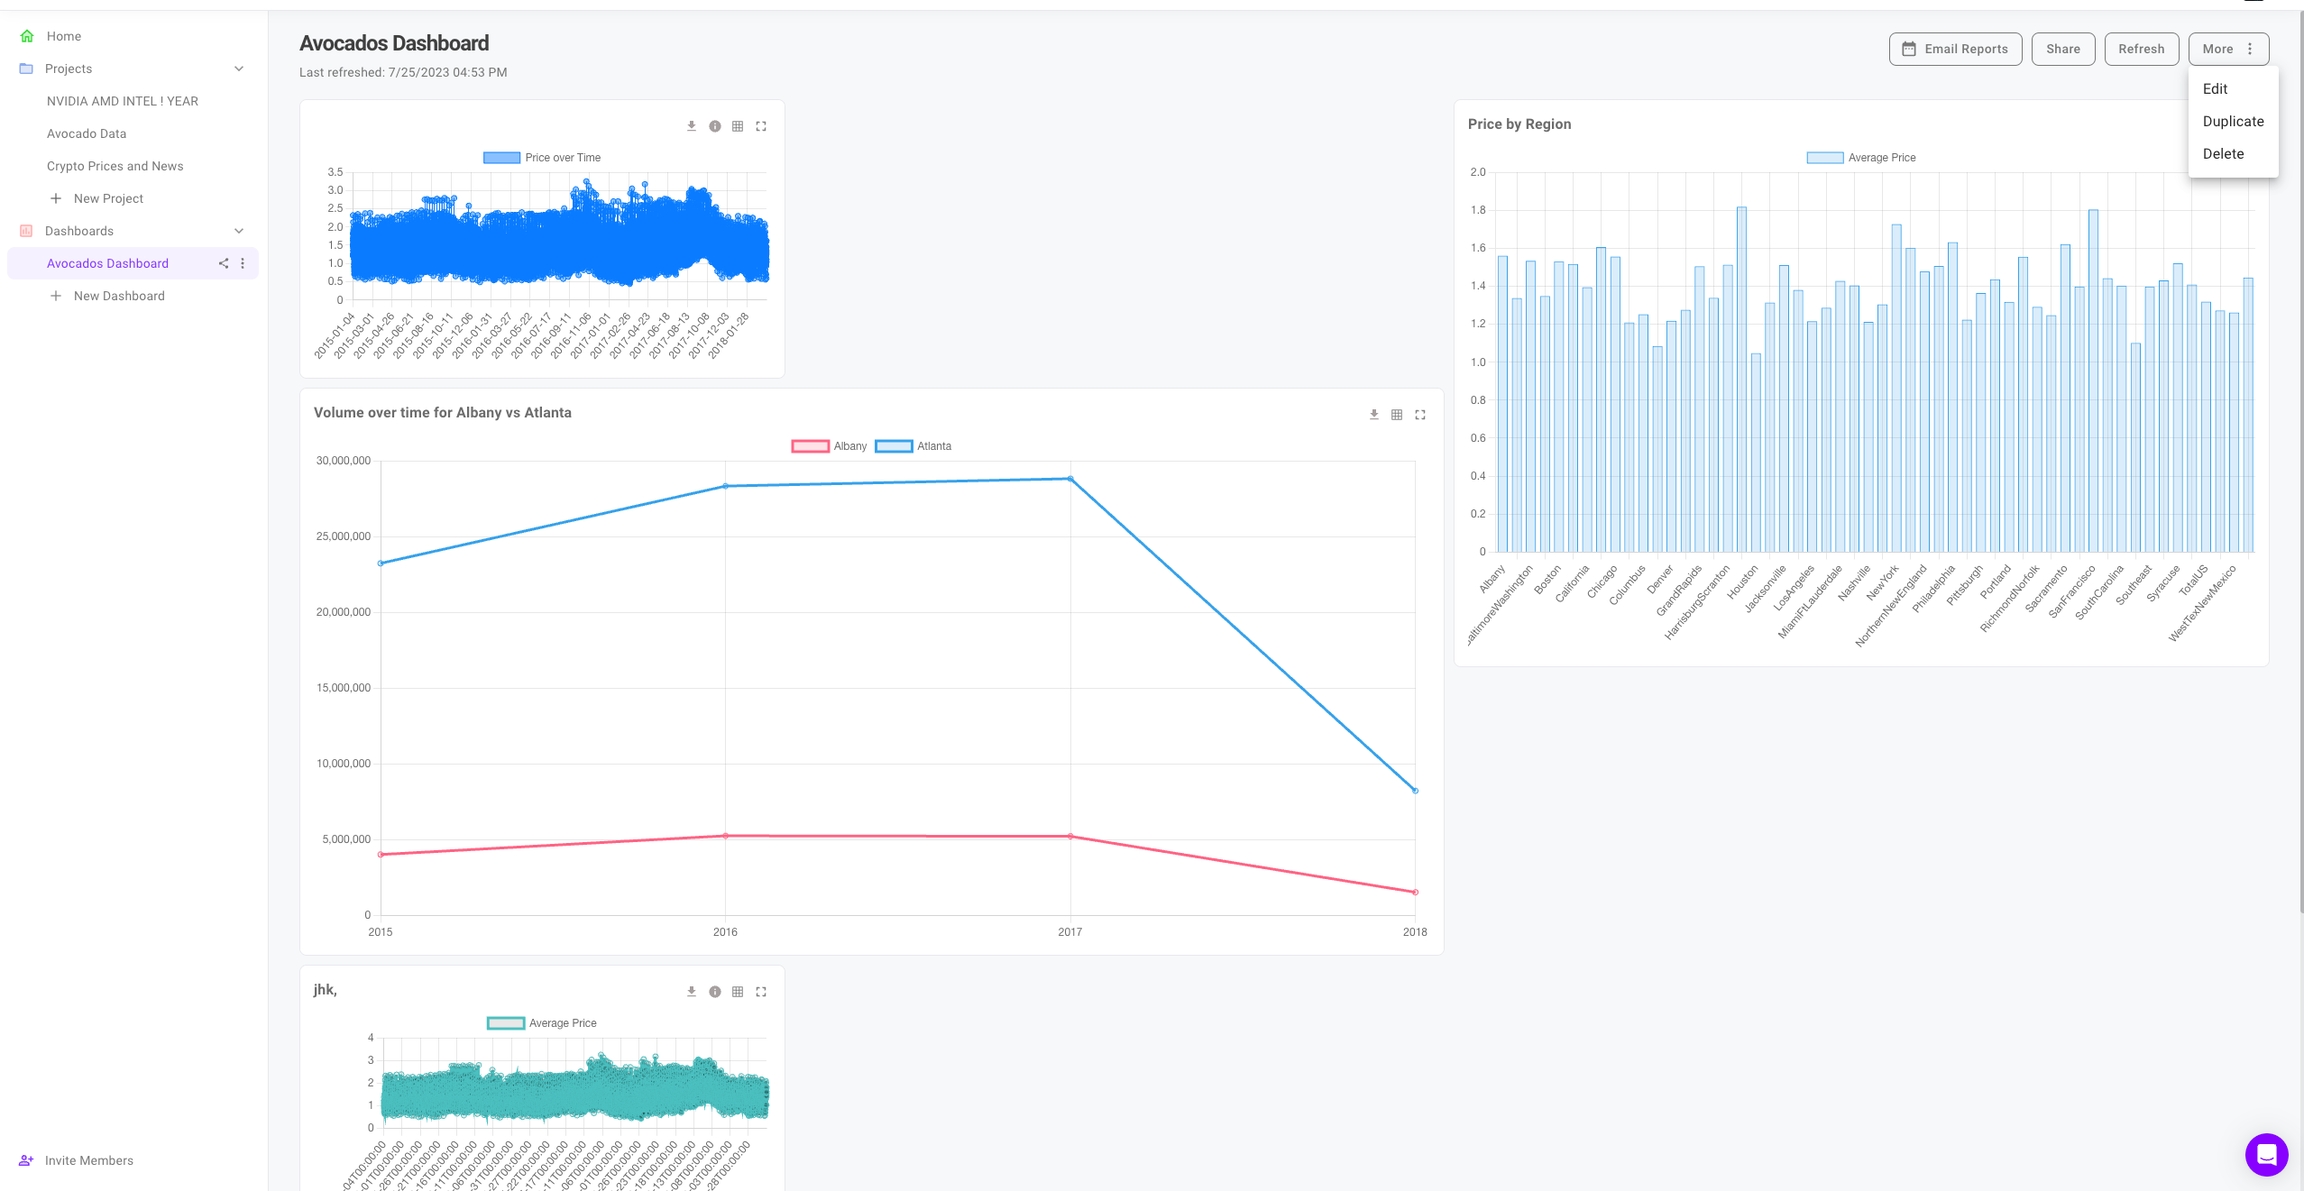
Once you create your dashboard it will show up on your left sidebar. Click on it to go to it and view your saved graphs. At the top right you will have buttons to modify the Share settings, add/remove Email Reports, and a Refresh button to make all of your graphs update their data immediately. The More button will give you access to editing, duplicating, or deleting the dashboard.
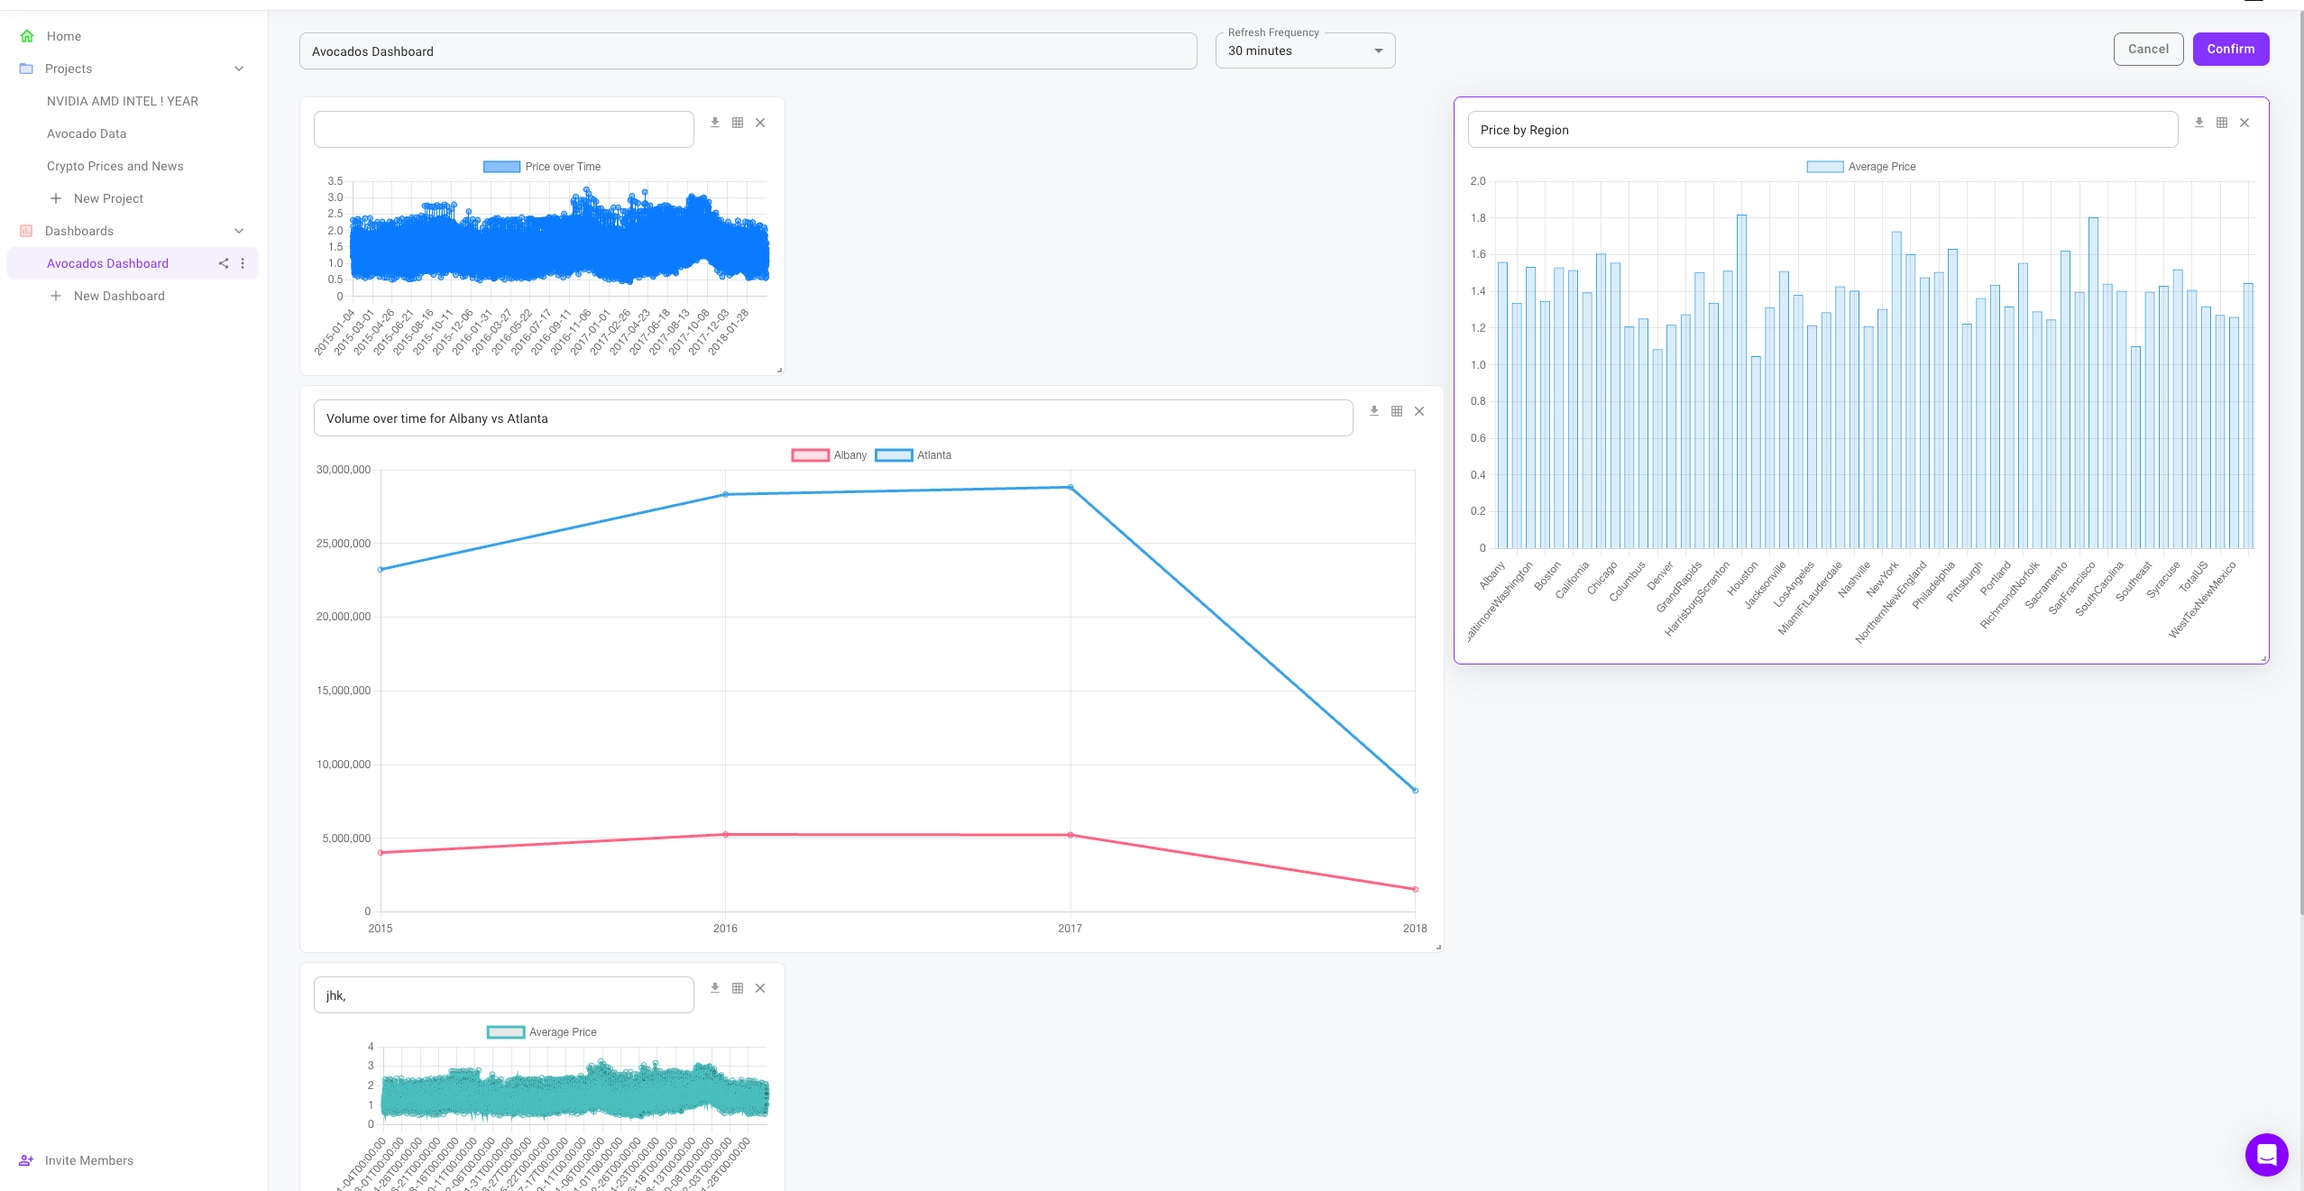
If you select Edit, you will get the edit view where you can drag, resize, or remove graphs. You can also change the title or refresh interval of your dashboard at the top.
Last updated